Markets Today▲ index
Trump declares the Iran ceasefire ‘over’ after an overnight US strike — Brent settles +5.2% at $78.02, WTI +4.4% at $73.52, and the JMIC lifts the Hormuz threat to ‘severe’
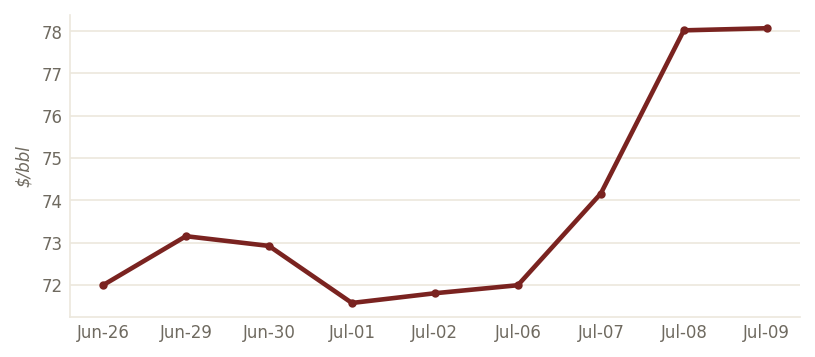
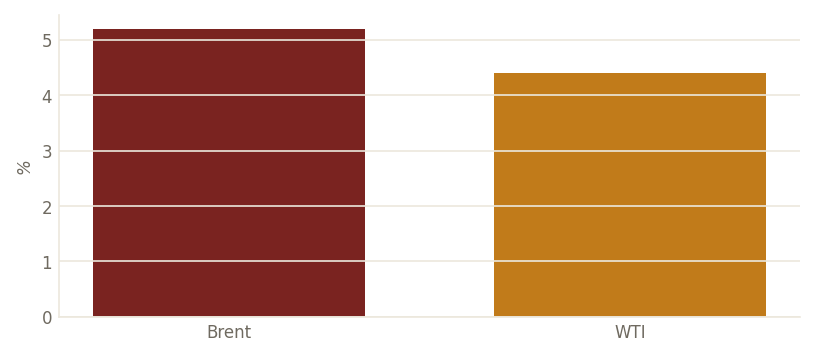
The tape's dominant story is geopolitical. Speaking at the NATO summit in Turkey, President Trump said he now considers the ceasefire with Iran ‘over,’ calling further negotiation ‘a waste of time’ — remarks that followed an overnight US strike on the Islamic Republic and came after three vessels were attacked in or near the Strait of Hormuz on Tuesday. Tehran's foreign ministry called the strikes a ‘gross violation’ of last month's memorandum of understanding, and the US-led Joint Maritime Information Center raised its threat assessment for ships transiting the waterway to ‘severe.’ Oil re-armed the supply premium it had bled out through June: Brent futures jumped 5.2% to settle at $78.02 on Jul-08 (the lake carries a fresh $78.07 Jul-09 mark) and WTI rose 4.4% to $73.52, per CNBC. Roughly a fifth of seaborne crude prices through Hormuz, so the market is pricing a disruption tail, not a confirmed cut — but it lands at the worst possible moment for a Fed already worried that energy is re-broadening inflation.
June FOMC minutes land hawkish: rate held at 3.50–3.75% by a 12–0 vote, cut hints removed, and officials flag inflation broadening beyond energy and tariffs
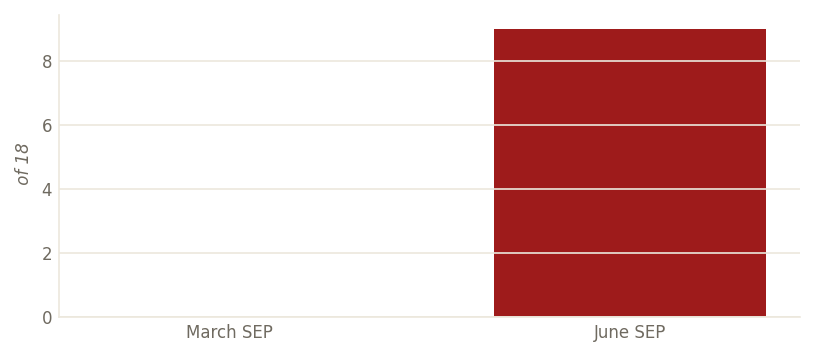
Wednesday's 2 p.m. ET release of the June 16–17 minutes read more hawkish than the market wanted. The committee held the target range at 3.50–3.75% by a 12–0 vote and, per TradingKey's read, shifted to a neutral, wait-and-see stance while stripping out earlier language that had hinted cuts could come soon — a ‘few officials’ saw a case to raise rates. The load-bearing detail: officials confirmed that price pressures are no longer confined to exogenous drivers like energy and tariffs but are spreading across categories including transportation and airfares, making upside inflation risk the ‘core conflict’ of the meeting. That reframing matters more now than when the minutes were written, because an oil supply shock arrived the same afternoon. The June SEP dots already leaned hawkish — nine of eighteen officials had penciled in at least one more hike by year-end versus none in March, with Chair Warsh declining to file his own projection.
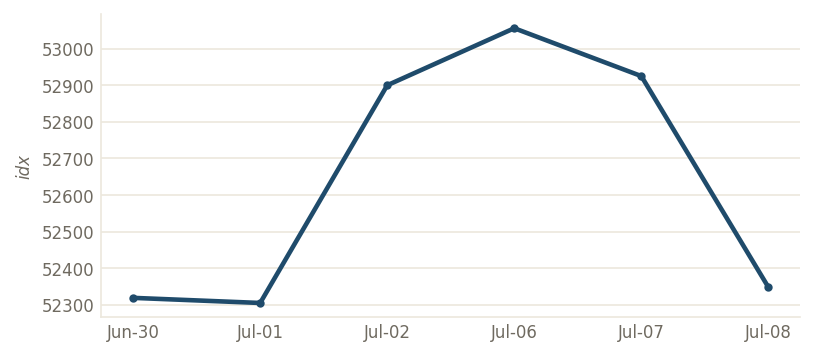
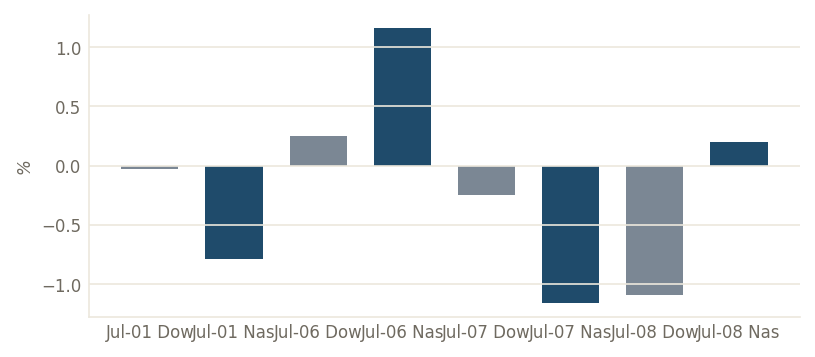
Wednesday's tape splits again: the Dow sheds 577 points (-1.09%, lake 52,348) as financials break while chips rebound — SMH +1.99% and the Nasdaq eked out a gain
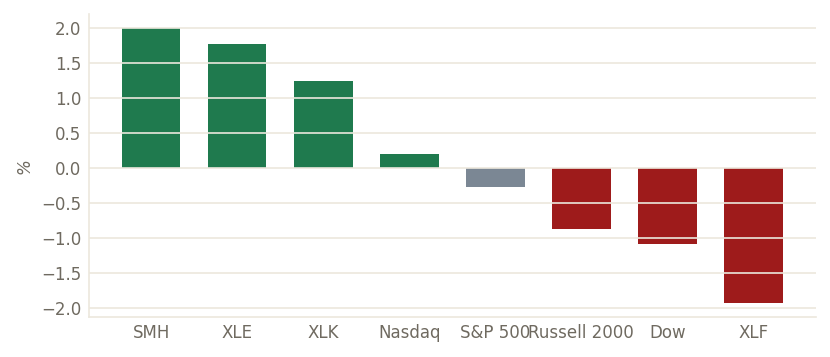
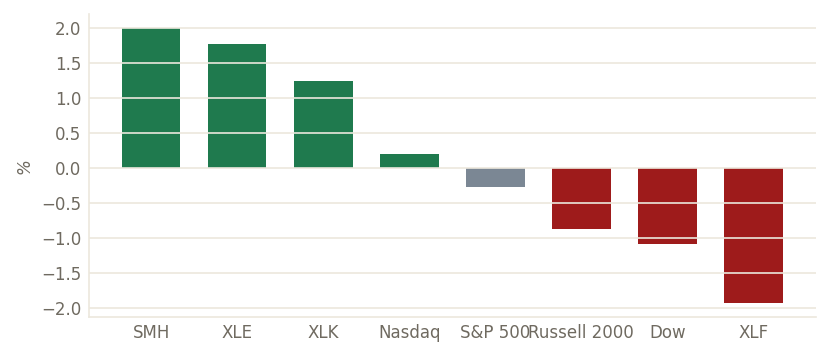
Leadership flipped for a third straight session. The two-day chip rout reversed — the lake-measured semiconductor ETF (SMH) rose 1.99% and broad tech (XLK) 1.24% on Jul-08 — but the rebound couldn't hold the index up: the Dow fell 577 points, a lake-measured 1.09% to 52,348.39, as financials cratered (XLF -1.93%) ahead of next week's bank-earnings kickoff and as the FOMC minutes plus the Iran escalation lifted yields. The S&P eased 0.28% to a lake-measured 7,482.71 while the Nasdaq composite scratched out a 0.20% gain to 25,870.65 on the chip bid. Energy led again (XLE +1.76%) as Brent surged. It is the mirror image of Monday's tape — then the Dow held while the Nasdaq broke; Wednesday the Dow broke while the Nasdaq held — the signature of an index with no stable leadership.
Futures shake off the Iran flare-up into Thursday's open — Dow futures +0.2%, with PepsiCo earnings and June existing-home sales on the docket
Pre-market Thursday, US equity futures pointed higher as investors looked past Wednesday night's US-Iran escalation: Dow futures were up about 82 points (0.2%) with S&P 500 futures also firmer, per Bloomberg's live coverage. The near-term calendar is light before next week's crush — Thursday brings June existing-home sales and PepsiCo (PEP) earnings, while the market's real catalysts sit on Jul-14: the June CPI print alongside the first wave of big-bank results (JPMorgan, Bank of America, Goldman Sachs, Wells Fargo and Citigroup). With the Dow having pierced 53,000 for the first time on Monday before giving it all back, the index enters Thursday roughly where it started the month — the whole week's drama has been rotation, not direction.
Equities & Sectors▲ index
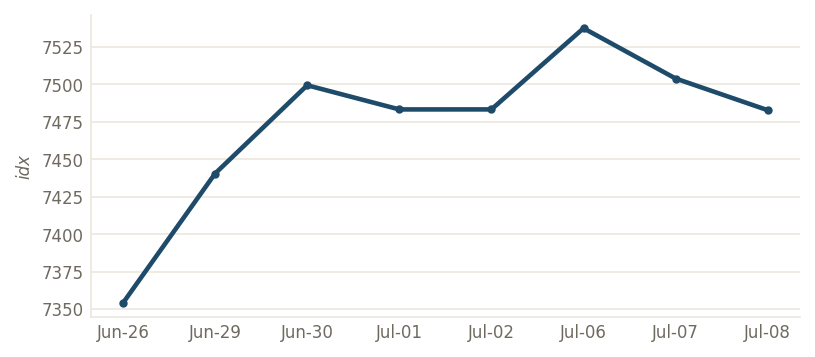
S&P 500: 7,482.71 (Jul-08 close, lake) — -0.28% as a financials break offsets the chip rebound
The S&P closed at a lake-measured 7,482.71 on Jul-08, off 0.28% on the session and a third consecutive down day after Monday's 7,537.43 record. The composition keeps turning: semis rebounded (SMH +1.99%, lake) and energy led (XLE +1.76%), but financials (XLF -1.93%) supplied the drag into bank earnings and the FOMC-minutes-plus-Iran yield backup. The index sits about 0.7% below its all-time high with leadership rotating almost daily — a market that can't decide whether the story is AI capex, oil, or the Fed.
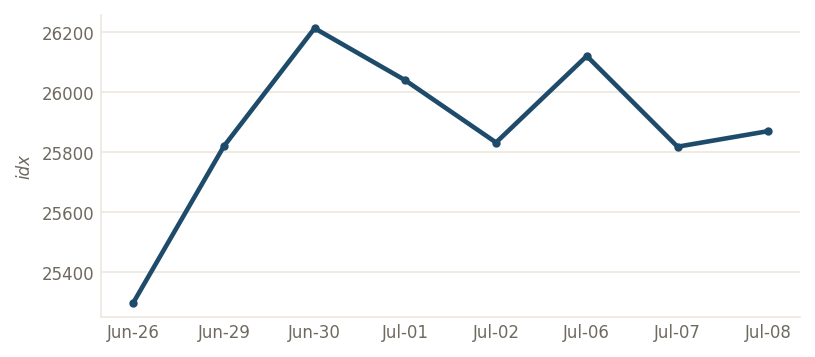
Nasdaq Composite: 25,870.65 (Jul-08 close, lake) — +0.20% as the chip complex claws back
The Nasdaq composite rose to a lake-measured 25,870.65 on Jul-08, up 0.20% (Bloomberg pegged the Nasdaq 100 up about 0.3%) as the two-day chip rout reversed and semis led the tape higher. It is the clean counterpoint to the Dow's 577-point slide: with the AI/mega-cap complex the index's dominant weight, a bounce in SMH mechanically lifts the composite even as rate-sensitive and financial names sink. The rebound looks like a crowded-trade snapback rather than a fresh leg — leadership has now handed off three sessions running and Q2 earnings, which begin next week, are the arbiter of whether the concentration re-firms.
Under the hood: Jul-08's leadership map — chips and energy up, financials and the Dow crushed
Wednesday's single-session map inverts Monday's. Money rotated back into the AI-capex complex — semiconductors (SMH +1.99%, lake) and broad tech (XLK +1.24%) — and into physical energy (XLE +1.76%) as Brent surged, while financials (XLF -1.93%) and small-caps (Russell 2000 -0.88%) took the hit that dragged the Dow down 1.09%. The split explains the paradox of a green Nasdaq on a day the Dow shed 577 points. Read against still-tight credit (IG at a lake-measured 76bp, HY 267bp on the Jul-07 mark), this remains a rotation inside risk assets rather than a broad de-risking — but the financials break the day before JPMorgan reports is worth watching.
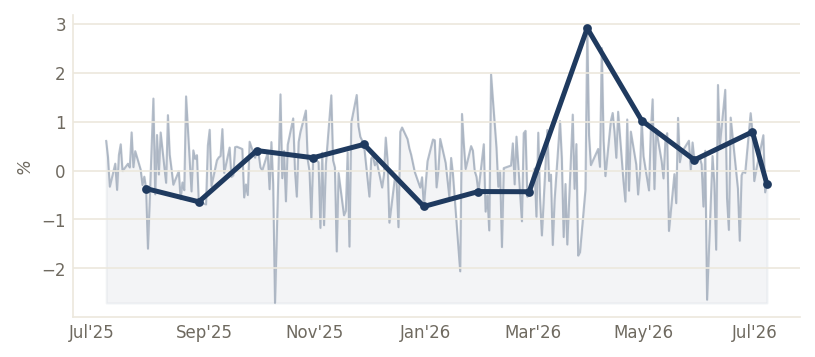
S&P 500 -0.3%
S&P 500 fell 0.3% on the session.
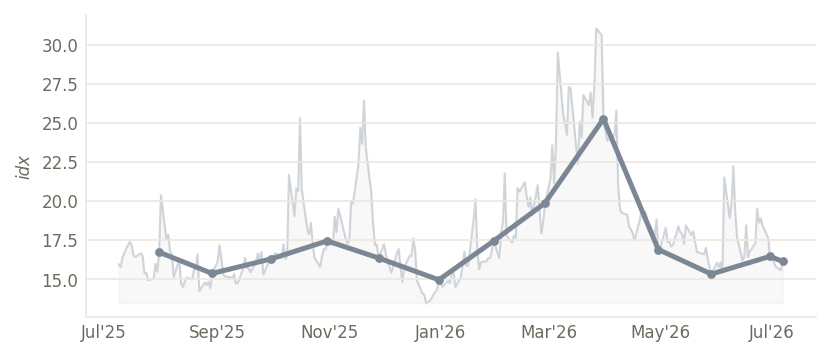
CBOE Volatility (VIX): 16.1
CBOE Volatility (VIX) rose to 16.1 from 15.6.
Rates, Credit & Vol▲ index
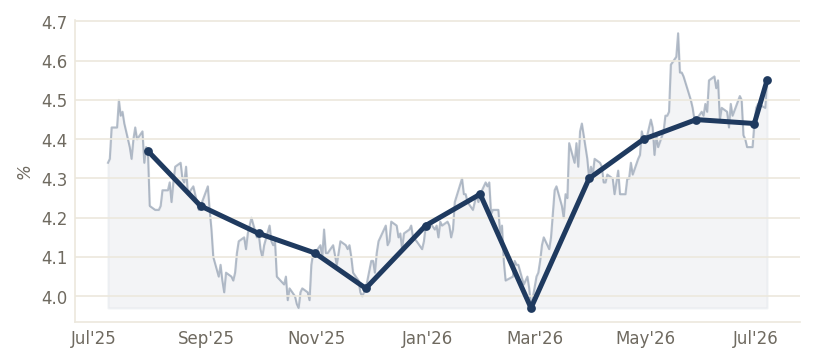
US 10Y Treasury Yield: 4.5%
US 10Y Treasury Yield rose to 4.5% from 4.5%.
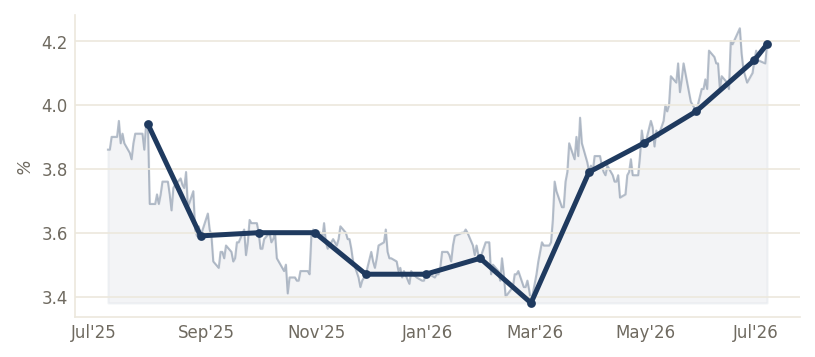
US 2Y Treasury Yield: 4.2%
US 2Y Treasury Yield rose to 4.2% from 4.1%.
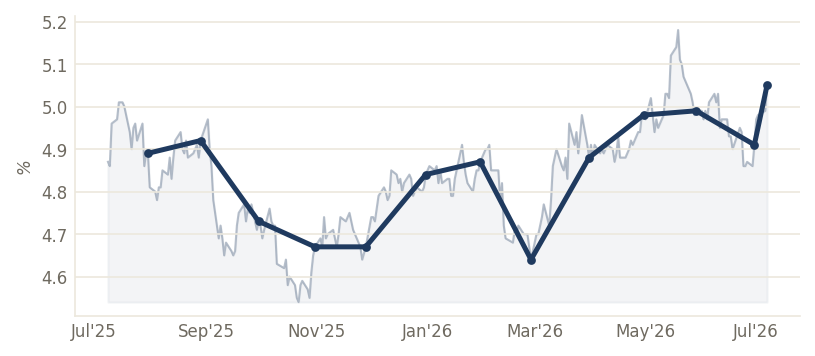
US 30Y Treasury Yield: 5.0%
US 30Y Treasury Yield rose to 5.0% from 5.0%.
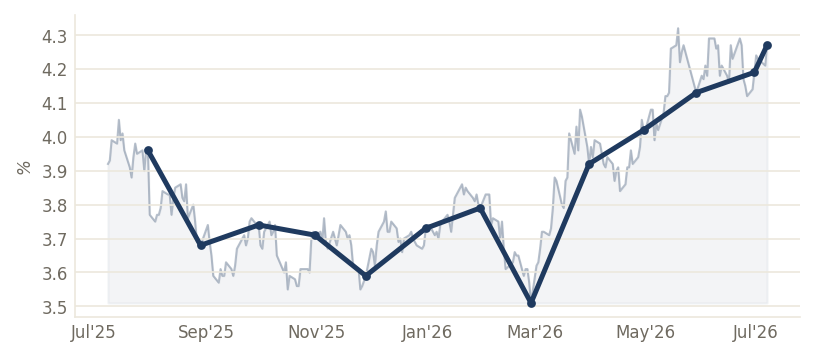
US 5Y Treasury Yield: 4.3%
US 5Y Treasury Yield rose to 4.3% from 4.2%.
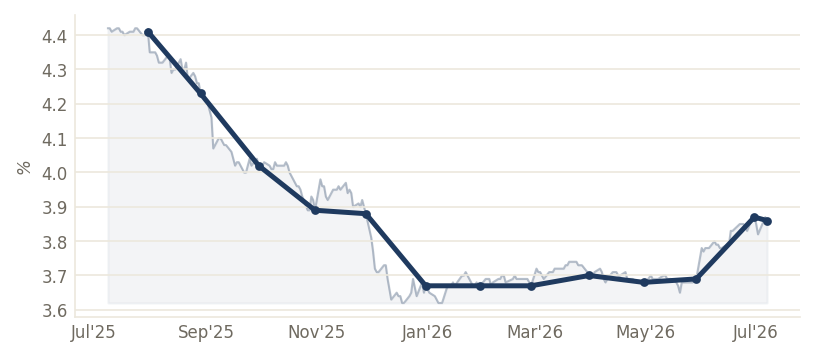
US 3M T-Bill Yield: 3.9%
US 3M T-Bill Yield eased to 3.9% from 3.9%.
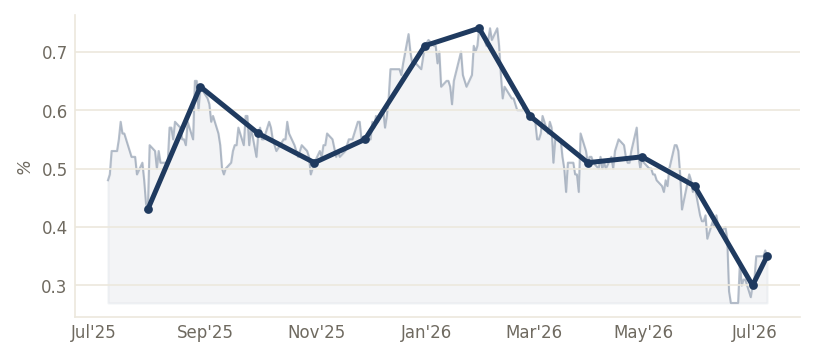
2s10s Curve Spread: 0.3%
2s10s Curve Spread eased to 0.3% from 0.4%.
10Y Real Yield (TIPS): 2.3%
10Y Real Yield (TIPS) rose to 2.3% from 2.2% — a multi-year high.
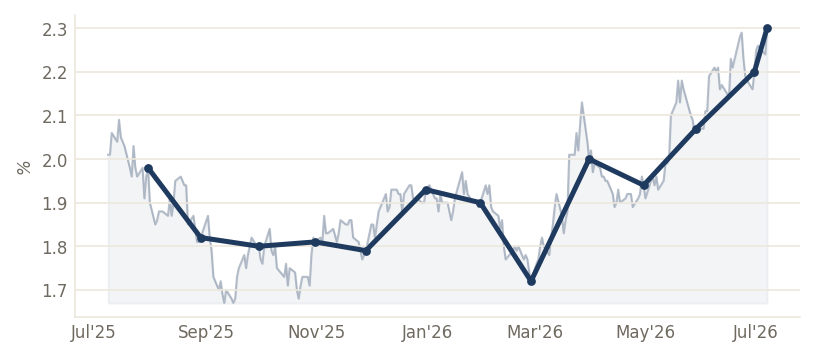
5Y Breakeven Inflation: 2.3%
5Y Breakeven Inflation rose to 2.3% from 2.3%.
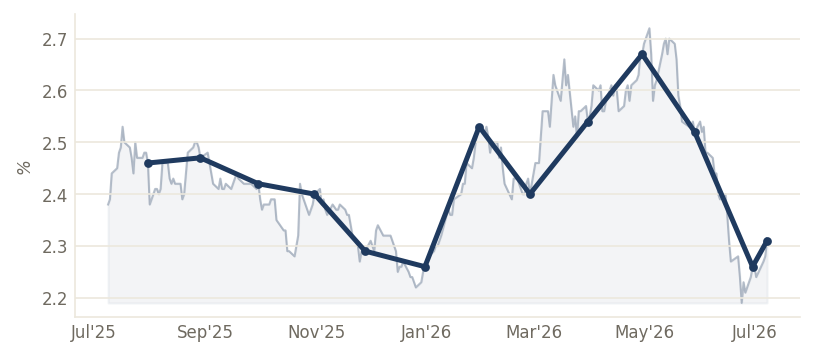
10Y Breakeven Inflation: 2.2%
10Y Breakeven Inflation held at 2.2% from 2.2%.
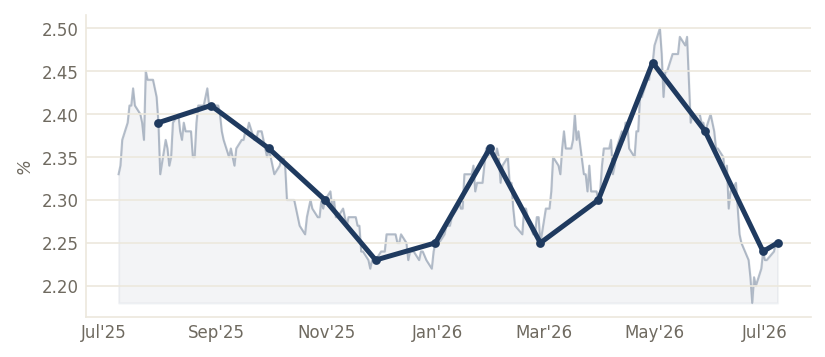
US Investment-Grade OAS: 0.8%
US Investment-Grade OAS rose to 0.8% from 0.8%.
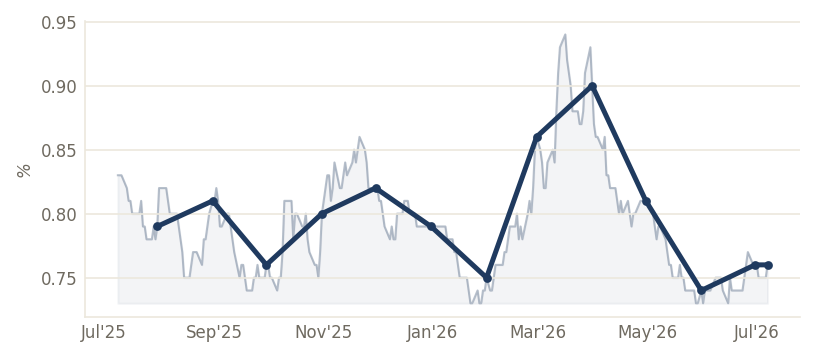
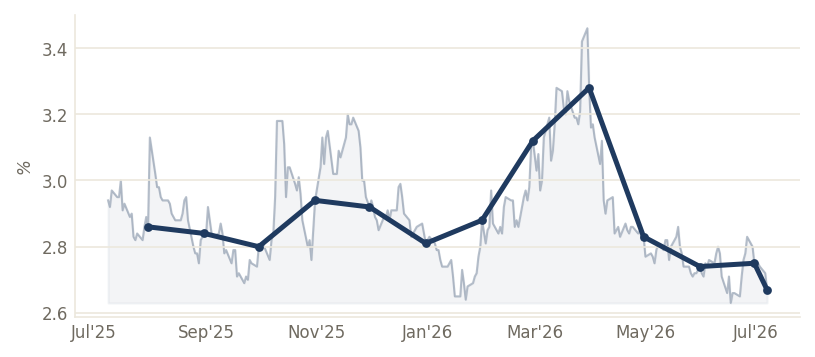
US High-Yield OAS: 2.7%
US High-Yield OAS eased to 2.7% from 2.7%.
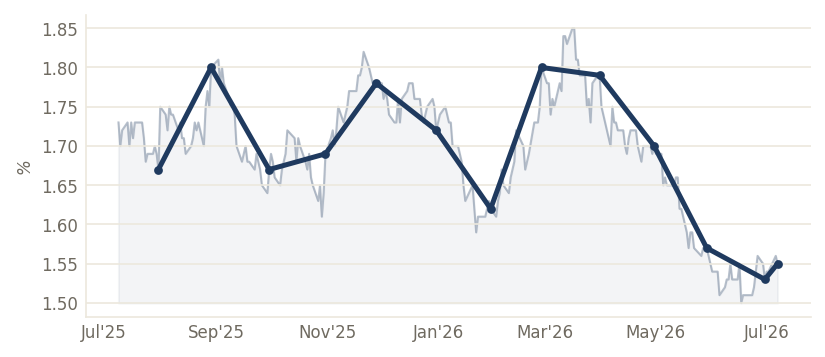
Baa Corporate Spread: 1.6%
Baa Corporate Spread eased to 1.6% from 1.6%.
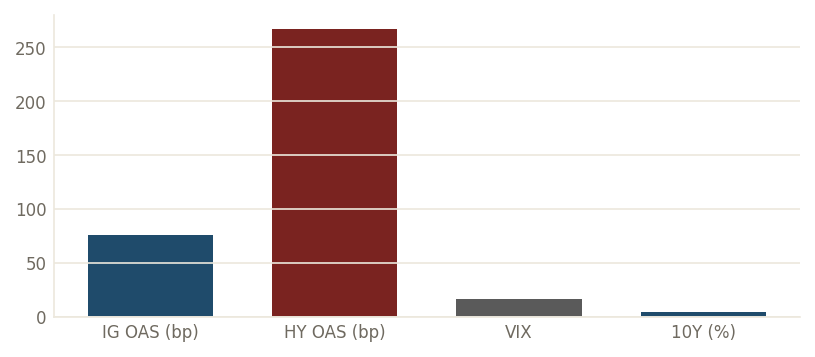
The credit-and-vol tell: yields back up to a lake-measured 10Y 4.55% while spreads stay tight and the VIX only ticks to 16
The rate complex did the work the equity tape wouldn't. The lake's 10Y UST yield stepped up to 4.55% on the Jul-07 mark (+7bp), the 2Y to 4.19% and the 30Y to 5.05%, as the hawkish minutes and the oil-driven inflation scare pushed the curve higher — yet the risk instruments stayed calm. IG OAS held at a lake-measured 0.76% and HY OAS eased to 2.67%, both near the year's tights; the VIX printed just 16.13. Two reads: (i) the financials break was about the yield backup and earnings risk, not credit stress; (ii) with breakevens firming (5Y at 2.31%, lake) the oil premium is leaking straight into inflation expectations — exactly the channel the minutes flagged as the committee's core worry.
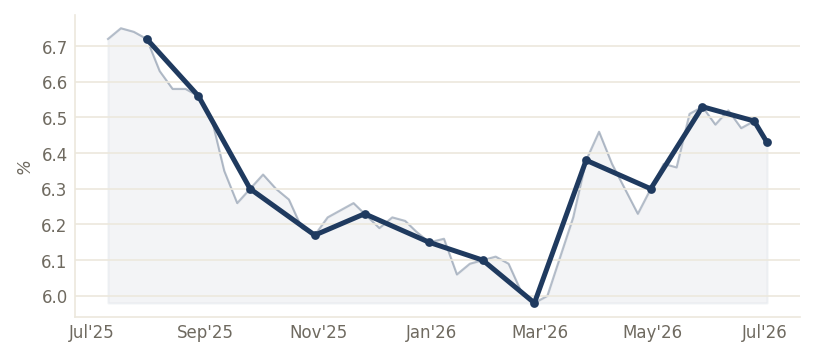
US 30Y Mortgage Rate: 6.4%
US 30Y Mortgage Rate eased to 6.4% from 6.5%.
Commodities▲ index
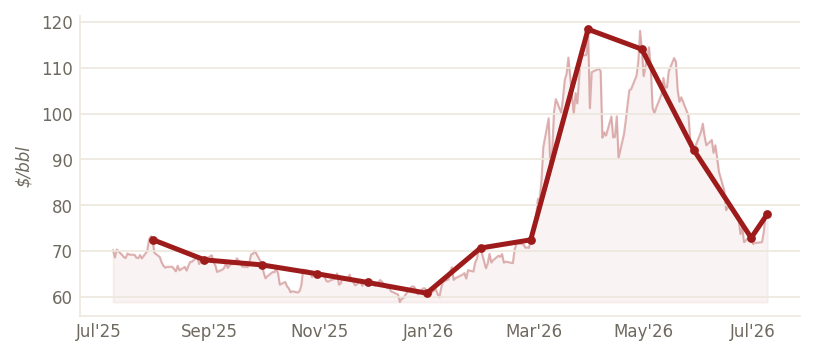
Brent Crude: $78.07
Brent Crude rose to $78.07 from $78.02.
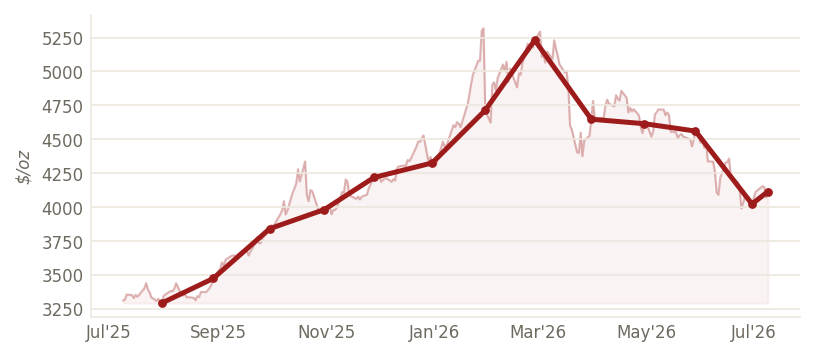
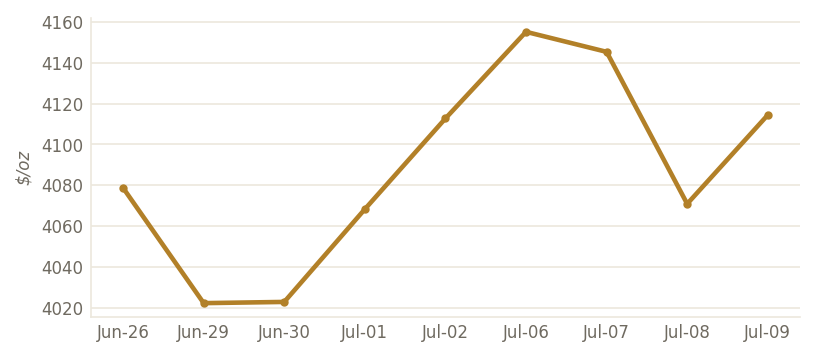
Gold (spot): $4,114
Gold (spot) rose to $4,114 from $4,071.
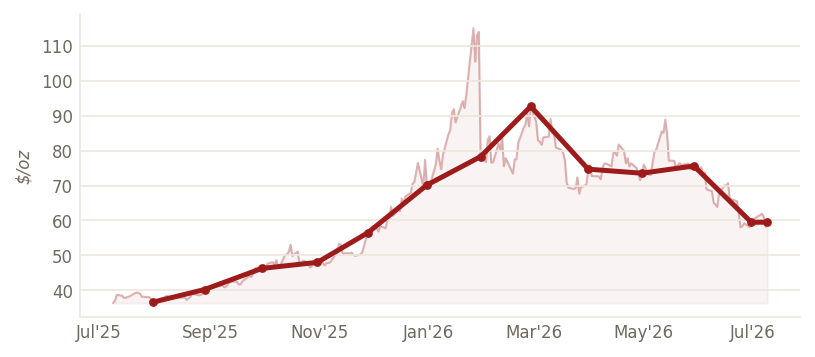
Silver (spot): $59.50
Silver (spot) rose to $59.50 from $58.16.
The gold paradox: an oil-supply shock is capping the safe-haven bid, not fueling it
Gold's Jul-09 lake mark of $4,114 is a modest 1.1% bounce off Wednesday's $4,071 low, and the muted response to an open Iran conflict is the story. As GoldSilver frames it, the Hormuz supply shock cuts against gold rather than for it: the disruption raises inflation and therefore the odds of Fed rate hikes, lifting real yields (the lake's 10Y at 4.55%) and the opportunity cost of a zero-yield asset just as the safe-haven bid would otherwise pull the metal up. Gold hit its ~$5,595 all-time high in late January before the conflict re-escalated, and at the Jul-09 mark sits roughly 26% below that peak — a reminder that in 2026 the marginal driver of the gold price is the real-rate channel, not the geopolitical headline. Silver (lake $59.50) tracked the same push-pull.
WTI joins the surge: +4.4% to $73.52 on Jul-08 as the Hormuz risk premium re-arms the whole crude curve
The Iran escalation lifted both crude benchmarks in tandem: WTI settled up 4.4% at $73.52 and Brent up 5.2% at $78.02 on Jul-08, per CNBC. The move re-prices a Strait-of-Hormuz disruption tail that the market had largely discounted through June, when Brent traded in the low-$70s. It is not yet a confirmed supply cut — flows are still moving — but the JMIC's ‘severe’ threat assessment and Trump's blockade threat put a physical premium back on the tape. For equities the read is bifurcated as it was all week: energy leads (XLE +1.76%, lake) while transports and the disinflation trade suffer, and the Fed's inflation problem gets one notch harder.
FX & Global▲ index
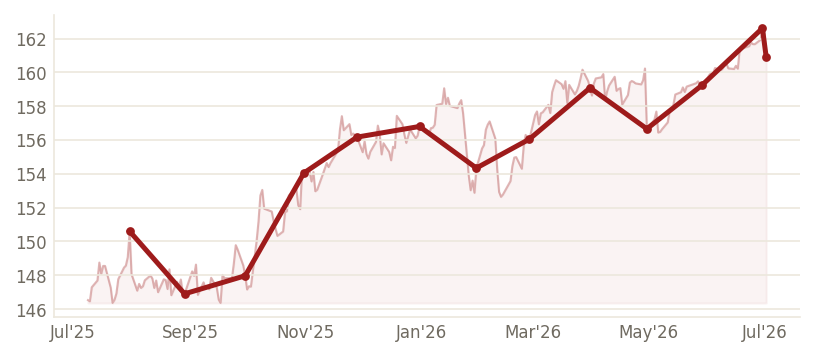
USD/JPY: 160.90
USD/JPY eased to 160.90 from 162.41.
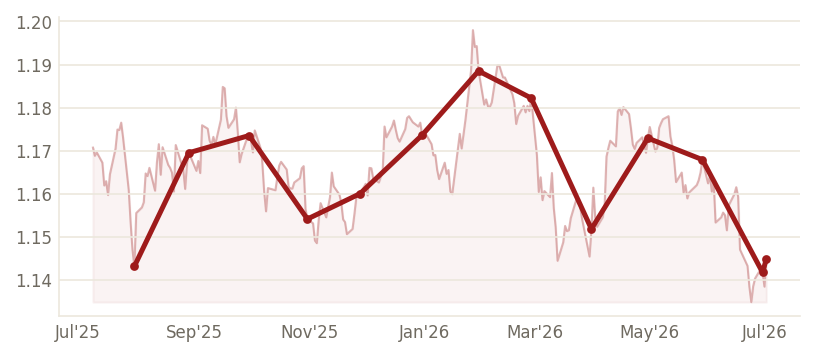
EUR/USD: 1.14
EUR/USD rose to 1.14 from 1.14.
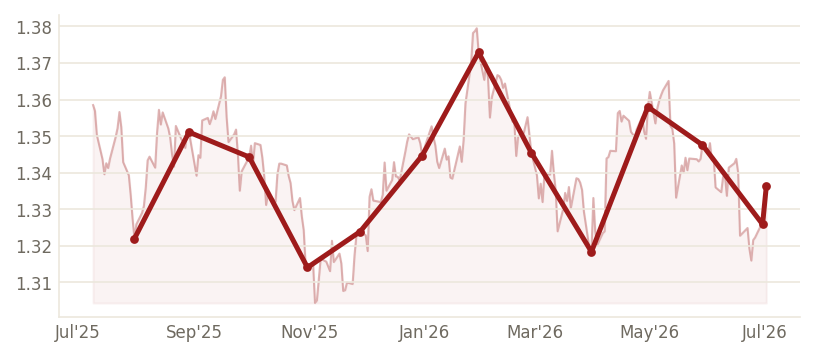
GBP/USD: 1.34
GBP/USD rose to 1.34 from 1.33.
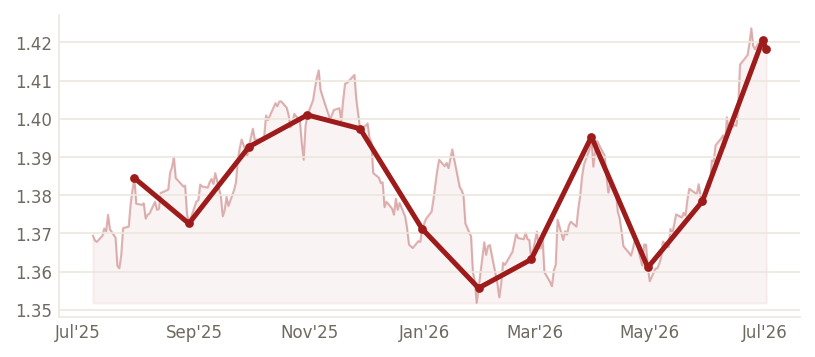
USD/CAD: 1.42
USD/CAD eased to 1.42 from 1.42.
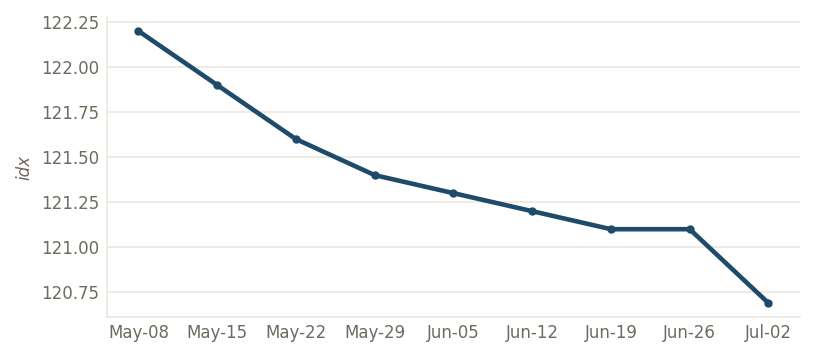
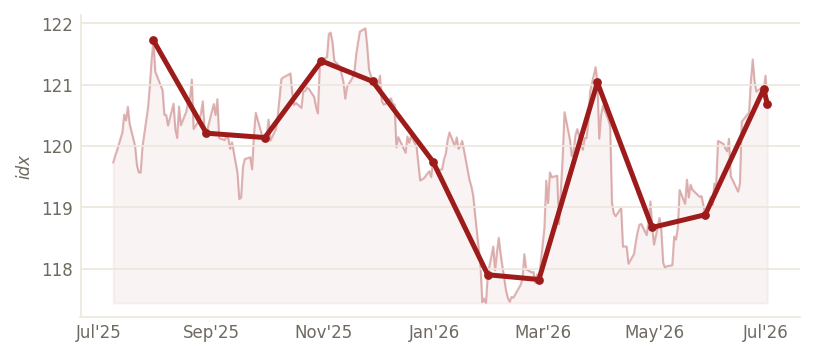
US Dollar (Broad): 120.7
US Dollar (Broad) eased to 120.7 from 121.1.
Labor & Housing▲ index
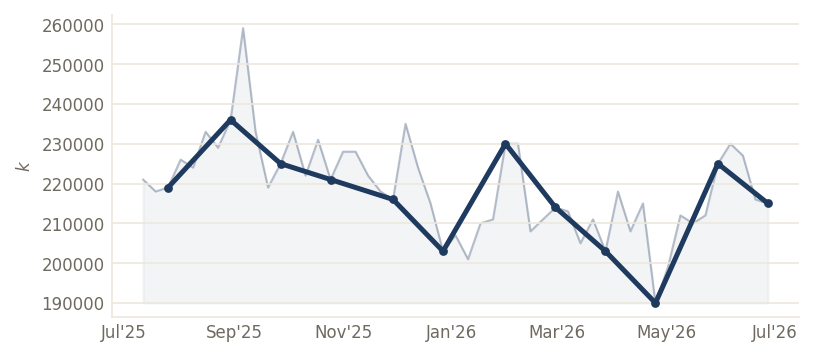
US Initial Claims: 215,000
US Initial Claims eased to 215,000 from 216,000.
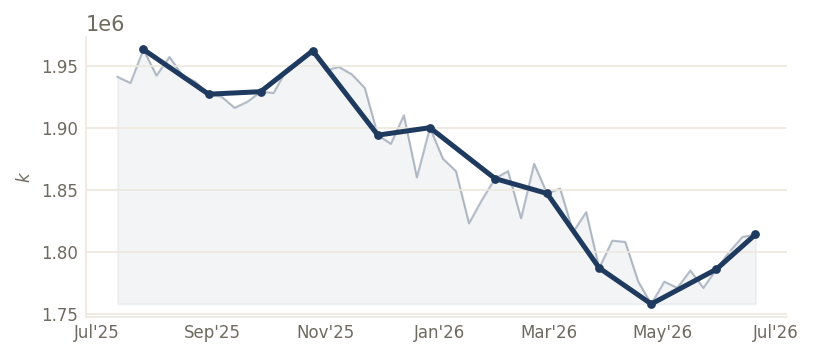
US Continued Claims: 1.81M
US Continued Claims rose to 1.81M from 1.81M.
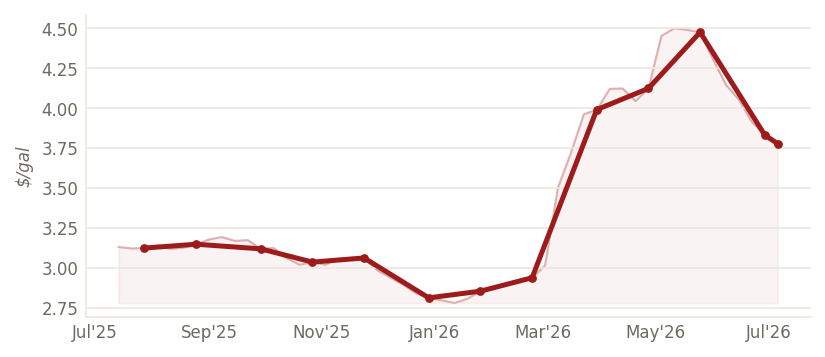
US Retail Gasoline: $3.78
US Retail Gasoline eased to $3.78 from $3.83.
Fed & Policy▲ index
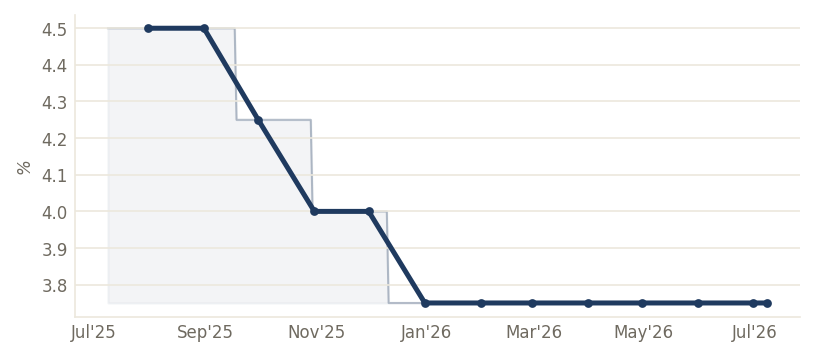
Fed Funds (upper): 3.8%
Fed Funds (upper) held at 3.8% from 3.8% — a multi-year high.
The minutes' real message: ‘on hold longer’ hardens into ‘a few want to hike’ as inflation broadens
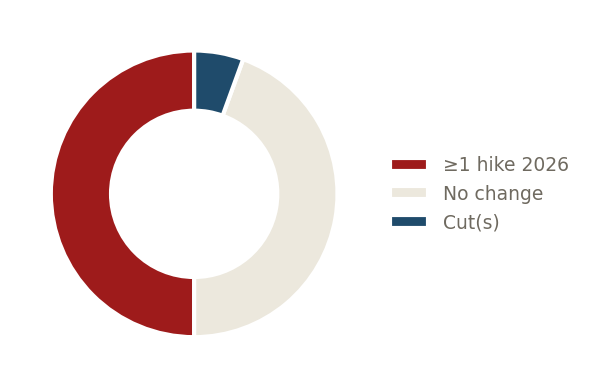
Strip the summary to its load-bearing sentence and the June minutes say the reaction function has moved. The committee held at 3.50–3.75% (12–0) but shifted to an explicitly neutral, wait-and-see posture, deleted the language that had kept a near-term cut on the table, and recorded a ‘few officials’ arguing for a hike — with the decisive worry being that inflation is broadening beyond energy and tariffs into wider categories that TradingKey's read of the minutes flags as including transportation and airfares. That is the hawkish reading of the June SEP, where nine of eighteen dots wrote in at least one more hike by year-end and only one wrote in a cut, and Chair Warsh withheld his own projection. The cruel timing: the same afternoon the minutes published, an oil-supply shock arrived to validate exactly the inflation-broadening fear the committee had flagged. Markets now price the Fed's optionality tilted toward holding — or hiking — rather than cutting into H2.
Geopolitics & Trade▲ index
Iran ceasefire collapses: US strikes overnight, three tankers hit near Hormuz, and the waterway's threat level goes to ‘severe’
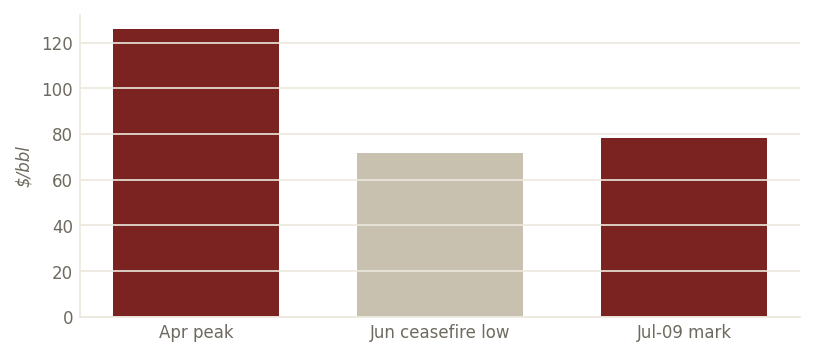
The June ceasefire framework has broken. At the NATO summit in Turkey, President Trump declared it ‘over’ and dismissed further talks as ‘a waste of time,’ after a US strike hit Iran overnight and following Tuesday's attack on three vessels in or near the Strait of Hormuz. Iran's foreign ministry called the strikes a ‘gross violation’ of the memorandum reached last month, and the US-led Joint Maritime Information Center raised the Hormuz transit threat to ‘severe,’ warning further hostile action is likely. Brent's lake mark at $78.07 (Jul-09) sits well below the ~$126 April post-war peak but has re-armed roughly seven dollars off the June low near $71.57 — a partial repricing of the ~20% of seaborne crude that transits the strait, not a full-blown supply crisis. For the tape it is the single largest cross-asset risk into the back half of July.
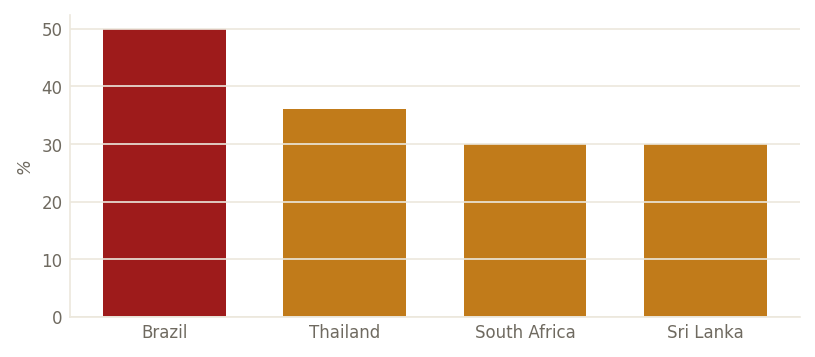
Tariff clock: reciprocal rates that were to expire Jul-9 are pushed to Aug-1 as letters go out — Brazil 50%, Thailand 36%, South Africa 30%
The trade calendar's pacing item reset this week. An executive order moved the reciprocal-tariff rates that had been set to expire Jul-9 out to Aug-1, and the administration sent letters to dozens of trading partners specifying the new rates: Brazil faces a headline 50%, Thailand 36%, South Africa 30% and Sri Lanka 30% (the last two modest reductions from their April levels), per TIME and ABC News. The White House counts signed frameworks with the UK, Vietnam and Indonesia plus a preliminary accord with China. For US equities the read is unchanged but now dated: Aug-1 is the second half's largest non-Fed, non-geopolitical policy risk, hitting exporters and consumer-discretionary margins directly while a firmer dollar and tariff-driven price pass-through feed the very inflation-broadening the Fed just flagged.
Crypto▲ index
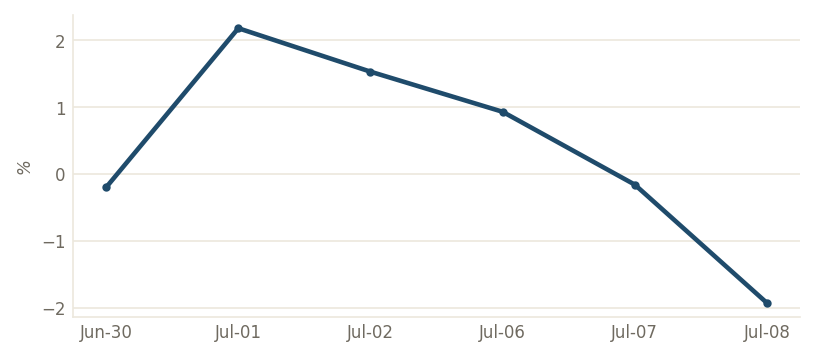
Bitcoin -0.7%
Bitcoin fell 0.7% on the session.
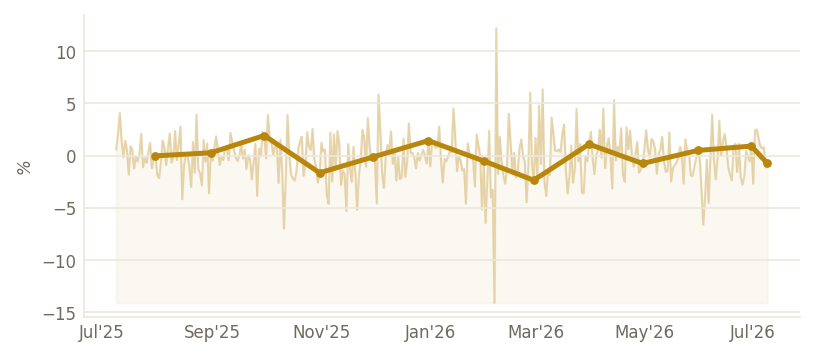
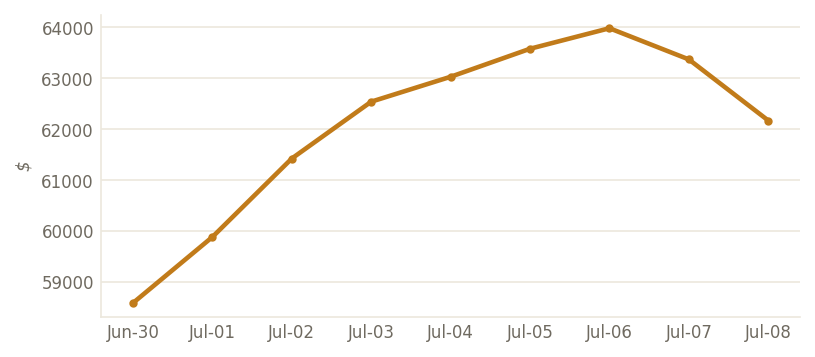
Bitcoin slips toward $62k as the risk-off yield backup bites the highest-beta book
The lake shows Bitcoin's daily return at -0.74% on the Jul-09 read after a -1.1% Jul-08 session, taking the level series back to roughly $62,168 from the $63,980 Jul-06 high. The move fits the week's macro: a hawkish minutes plus an oil-driven yield backup (10Y 4.55%, lake) tightens financial conditions, and BTC still trades as the highest-beta expression of the risk book that cuts duration and momentum first. The de-rating is orderly, not a break — the price stays inside its multi-month range and credit (HY OAS 2.67%, lake) is nowhere near confirming stress. A durable move lower would need the spread complex to crack, which it has not.
Corporate & Earnings▲ index
Bank earnings on deck Jul-14 — and financials broke 1.9% the session before, the sharpest sector loss on the tape
The Q2 reporting season opens Jul-14 with the money-center banks — JPMorgan, Bank of America, Goldman Sachs, Wells Fargo and Citigroup — reporting the same morning as the June CPI. The setup is uncomfortable: financials (XLF) were the worst-performing slice of Wednesday's tape, down a lake-measured 1.93%, as the yield backup and the FOMC-minutes-plus-Iran risk repriced the group lower right before it has to deliver numbers. Net-interest-margin guidance into a curve that just steepened at the long end (30Y 5.05%, 2s10s +0.35, lake), plus trading revenue off a volatile quarter, will set the tone for whether the broad index can find leadership that isn't the AI complex. PepsiCo (PEP) reports Thursday as the consumer-staples appetizer.
Food for Thought▲ index
The barbell inverts daily — this week the tape rotated leadership on all five sessions
A market with stable leadership does not flip its winners every session; this one did. Monday the Dow held while the Nasdaq broke on the Samsung/DeepSeek chip scare; Tuesday both fell on the chip rout's second leg; Wednesday the Dow shed 577 points while the Nasdaq eked out a gain as chips rebounded and financials broke. The through-line is that the index has no durable engine right now — AI capex, physical energy and rate-sensitives are trading places on the leadership board day by day. For allocators the practical implication is that single-day sector maps are noise; the signal is that breadth is thin enough that whichever crowded book unwinds sets the tape, and credit (IG 76bp, HY 267bp, lake) says none of it is systemic yet.
Oil-into-inflation is the transmission the Fed just told us it fears most
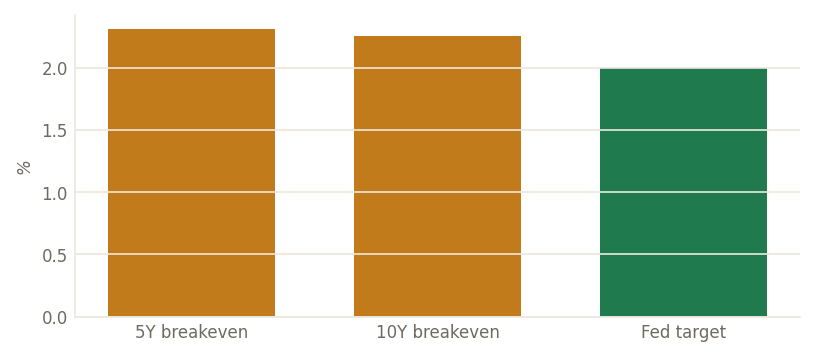
The reason Wednesday's two headlines are really one story: the June minutes flagged that inflation is broadening beyond energy and tariffs, and then an energy shock arrived to widen that base further. The market's inflation-expectation gauges are already leaning: the lake's 5Y breakeven at 2.31% and 10Y at 2.25% both sit above the Fed's 2% target, and a sustained Brent bid feeds straight into the front end of that curve. This is the mechanism that turns a Hormuz headline into a Fed problem — not the level of oil per se, but the way a supply-driven price rise lifts expectations and forces the committee to keep policy tight to prevent them from un-anchoring. Watch the 5Y breakeven as the cleanest daily read on whether the oil premium is becoming an inflation premium.
Real yields, not fear, are pricing gold — the cleanest lesson of the 2026 tape
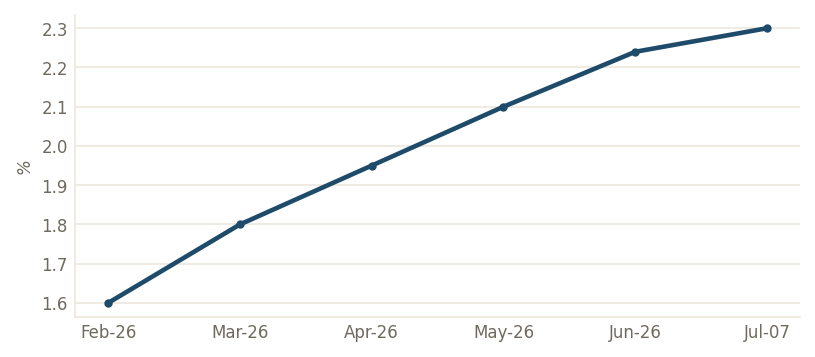
Gold's failure to spike on an open Iran conflict is not a market anomaly — it is the real-rate channel doing exactly what theory says. The lake's 10Y real (TIPS) yield has climbed to 2.30% (Jul-07 mark) as the Fed's hawkish hold pushed inflation-adjusted rates up, and a rising opportunity cost of holding a zero-yield asset is a heavier weight on the gold price than a geopolitical headline is a lift. That is why the metal is roughly 26% off its late-January ~$5,595 record even with a war on. The corollary for portfolio construction: in a regime where the Fed is the marginal price-setter, gold behaves less like a hedge against chaos and more like a long-duration bond — it wants lower real yields, and it isn't getting them.
Mortgage 30-year holds near 6.43% — the one rate the yield backup hasn't yet reached
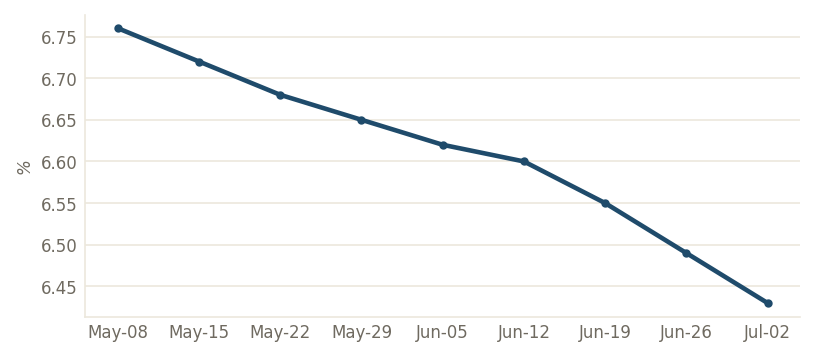
The lake's latest weekly read on Freddie's 30-year fixed prints 6.43%, about forty basis points below the spring high — but that series lags the daily curve, and the daily curve just backed up (10Y 4.55%, lake). The setup for housing into next week's existing-home-sales and the June CPI is a race: mortgage rates had been grinding lower on the softening-labor story, but a hawkish Fed plus an oil-driven inflation scare threatens to arrest that. Whether the marginal homebuyer keeps getting a discount rate that flexes with the labor data — or one that re-stiffens with the inflation data — is the swing factor for the sector that has quietly been one of the year's better rate-sensitivity trades.
The July calendar tightens: Jul-14 stacks June CPI on top of the first bank earnings
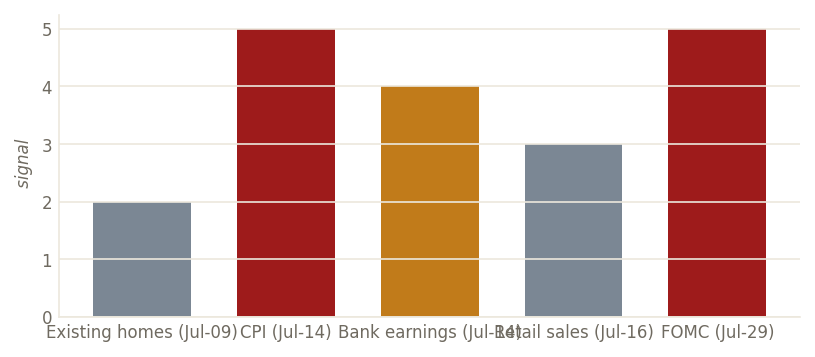
The market's real test arrives Jul-14, when the June CPI lands the same morning JPMorgan, Bank of America, Goldman, Wells Fargo and Citigroup open the Q2 reporting season. That single day tells you whether the inflation-broadening the Fed flagged is showing up in the hard data and whether the financials break of Jul-08 was prescient or overdone. Behind it, retail sales on the 16th pins down whether the June labor softening is reaching the consumer, and the FOMC decision on the 29th closes the month. Thursday's existing-home sales and PepsiCo print are the low-signal warm-up. The map is simple: rotation rules the tape until CPI and the banks give it a reason to trend.
The dollar sits just off its highs — a swing variable for an earnings season that starts next week
The Fed's trade-weighted broad dollar index (lake, Jul-02) prints 120.69, a touch below the spring high. Two crosscurrents now pull on it: a hawkish Fed and a re-armed oil premium argue for a firmer dollar (the ‘dollar smile’ intact), while the softening-labor story argues the other way. The resolution matters directly for the Q2 earnings that begin Jul-14 — US large-caps source roughly 40% of revenue abroad, so a dollar that stays off its highs is a translation tailwind after two quarters of drag, while a renewed spike on safe-haven and rate-differential flows would clip guidance. With the index sitting almost exactly mid-range, the FX market is as undecided about the H2 macro as the equity tape is about its leadership.